Using AI to Analyze My Portfolio
I don’t know why I hadn’t thought of it before.
Today I decided to upload my portfolio to “Gemini Pro 3” and see what it thought about it.
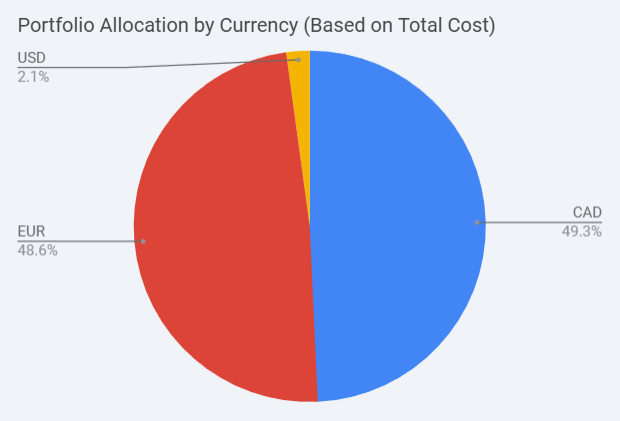
Now that’s just the currency of my holdings, not the underlying assets.
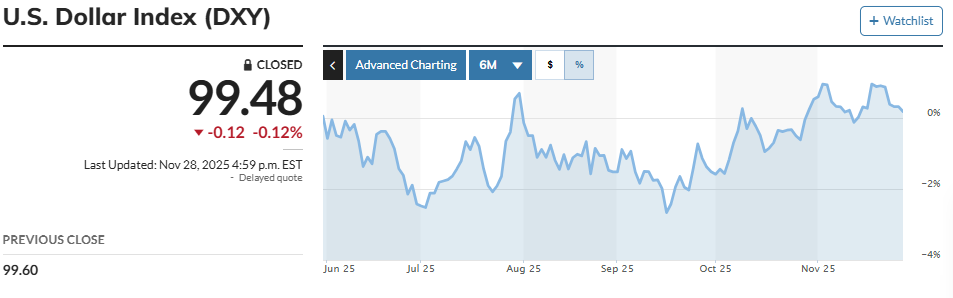
I think about 6-9 months ago, I became very bearish on the US Dollar and decided not to hold anything in USD.
The USD has changed by about 0% in the past six months. I thought it would be worse, but being out of it hasn’t hurt me.
It’s also plotted my holdings on a Risk vs Reward chart, showing my riskier holdings (volatility) are the worst performers.
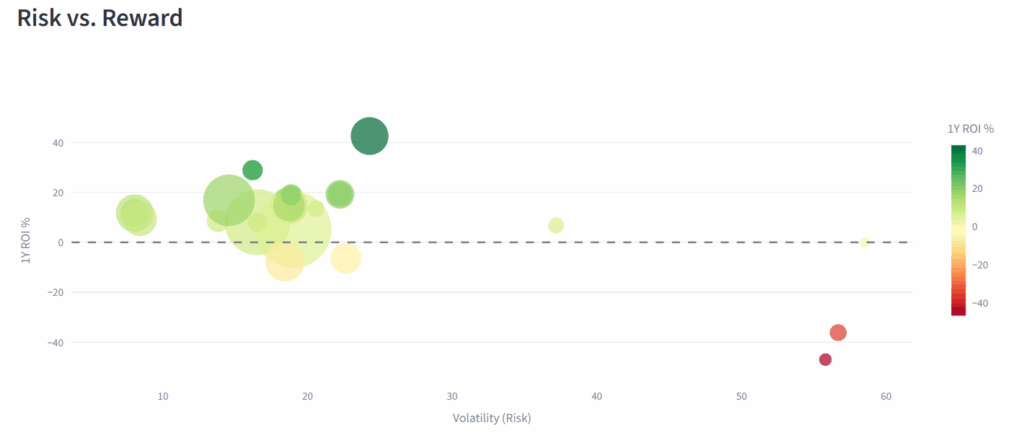
In the chart above, we can see some dots clustered around an area, and that’s generally the S&P 500.
VFV (S&P 500 Index Fund in Toronto) shows a volatility of 18 and a 1-year ROI of 14%. And so we see a lot of stuff hovering around that area. EQCL has around the same volatility but an 18% 1-year ROI. And VUAA (S&P 500 index fund in Europe) has around the same volatility and a lower 1-year ROI of 5%. The differences are sometimes currency, as all of this is normalized to US Dollars.
On the negative side, R2US (the Russell 2000 index fund in Europe) is showing volatility of 22 and a -6% 1-year ROI.
On the left side of the graph are preferred shares and relatively stable stocks. FFN and FTN are showing volatility around 8 and returns around 9%-11%. That’s a decent rate of return for low volatility. I like that.
On the bottom right are some of the riskier things I have bought. Novo Nordisk and Udemy are deeply negative on 1-year ROI, but I didn’t buy them at those prices, so those are not my own rates of return. Coursera is there too, on the right, being risky with no return.
Once more, I’m shown that the Russell 2000 index was not a great investment, the VanEck Moat Fund hasn’t been performing as well, nor the individual stocks that I have bought.
So I have some cleaning up to do.